Top Humon App Features and Tips to Make the Most of Your Workouts
Many new features have been added to the Humon app lately, so we’ve decided to compile a list of tips to help make the most of your workouts!
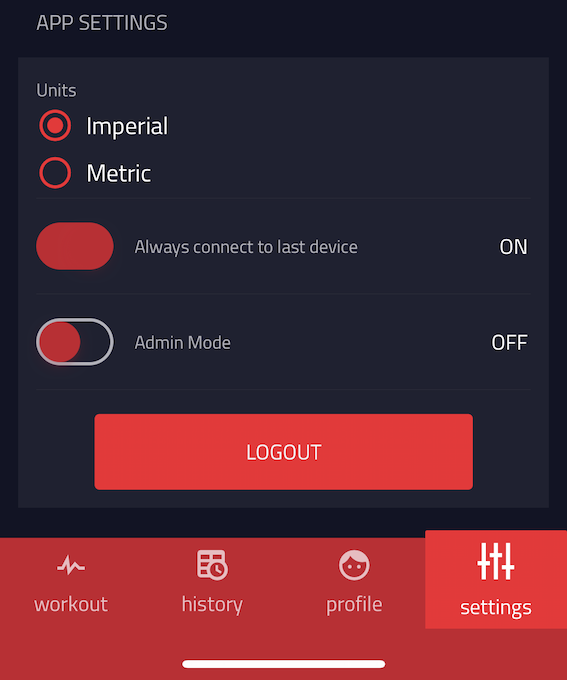
Always Connect to Last Device
An extremely useful button that often gets missed. If you are training in a group or on a team with multiple Humon Hex users, we recommend turning this button on. This button forces the app to only ever search for your device so you never have to worry about connecting to someone else! You can find this button on the settings tab near the bottom of the page.
Audio Feedback
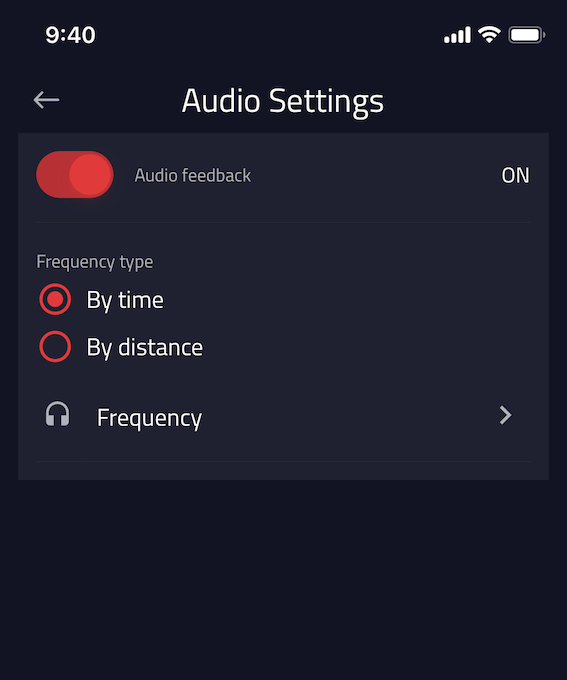
A recent feature that provides audio feedback about your muscle oxygen and GPS data during workouts. Under settings in the mobile app, you have the ability to shut this off for indoor workouts and modify the frequency and type of feedback received.
Recording on your Phone and Garmin Device Simultaneously
All you need to do for this one is start a workout using the mobile app first. Once a workout is recording on your phone, your Garmin device will automatically detect the Humon data via ANT+.
Pairing a Different Hex to your Garmin Device
The Hex pairs to your Garmin using its unique serial number to prevent any interference with different Hexes in the area. If you have multiple Hexes and are switching between them, you can reset the serial number by replacing it with “0” using Garmin Express or the Garmin Connect mobile app. You can then proceed as usual to connect with the different Hex.
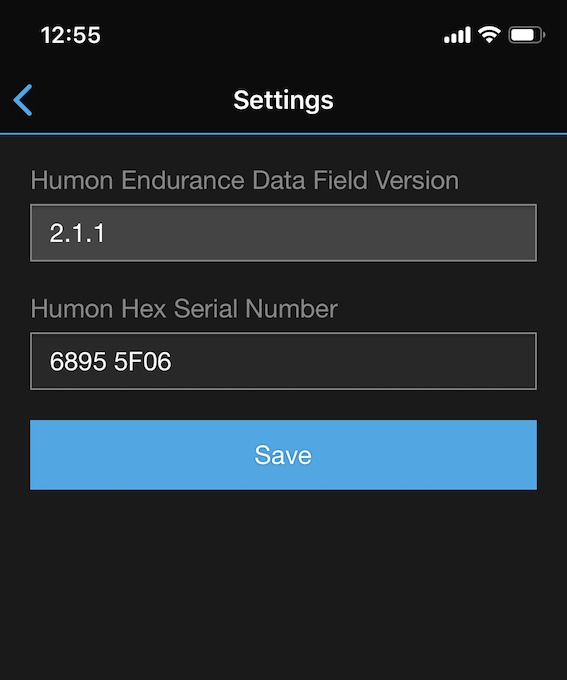
Import your Garmin Data into the Humon App
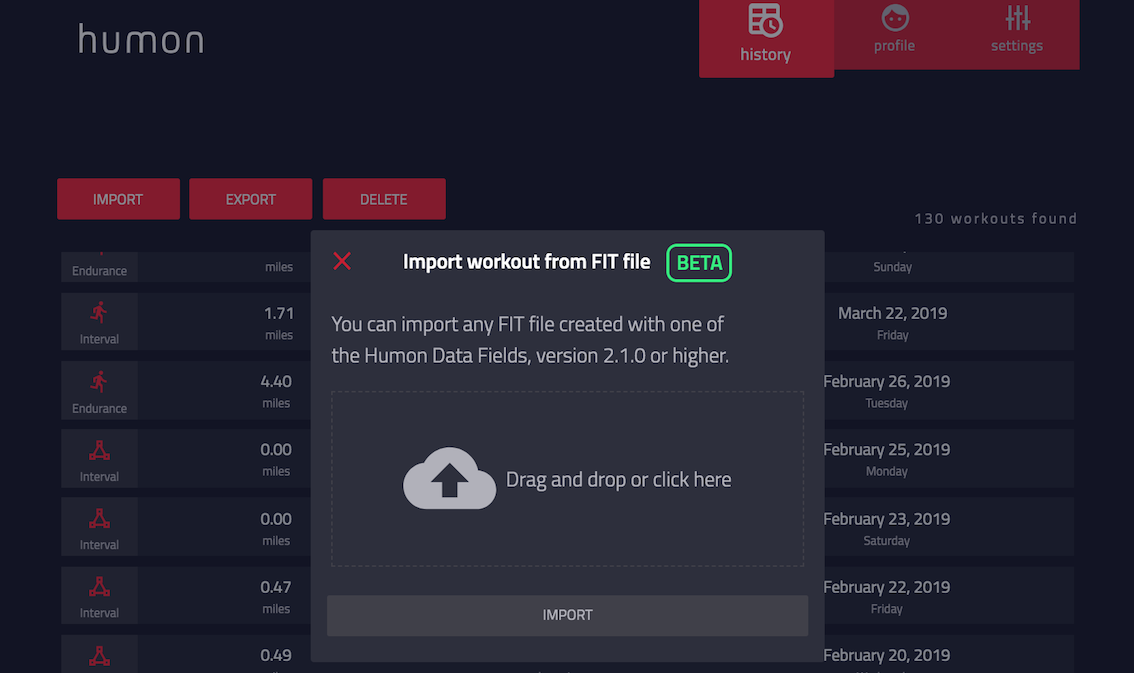
If you’re a Garmin user, you might have noticed that Garmin Connect does not display the colored zones on your post-workout data. This is no problem because you can easily export your Garmin Fit File and import it back to the Humon platform through our web app. You will then have full access to all of the analytics that the Humon apps provide.
Switch Between Real-Time Muscle Oxygen Percentage and Graph Views
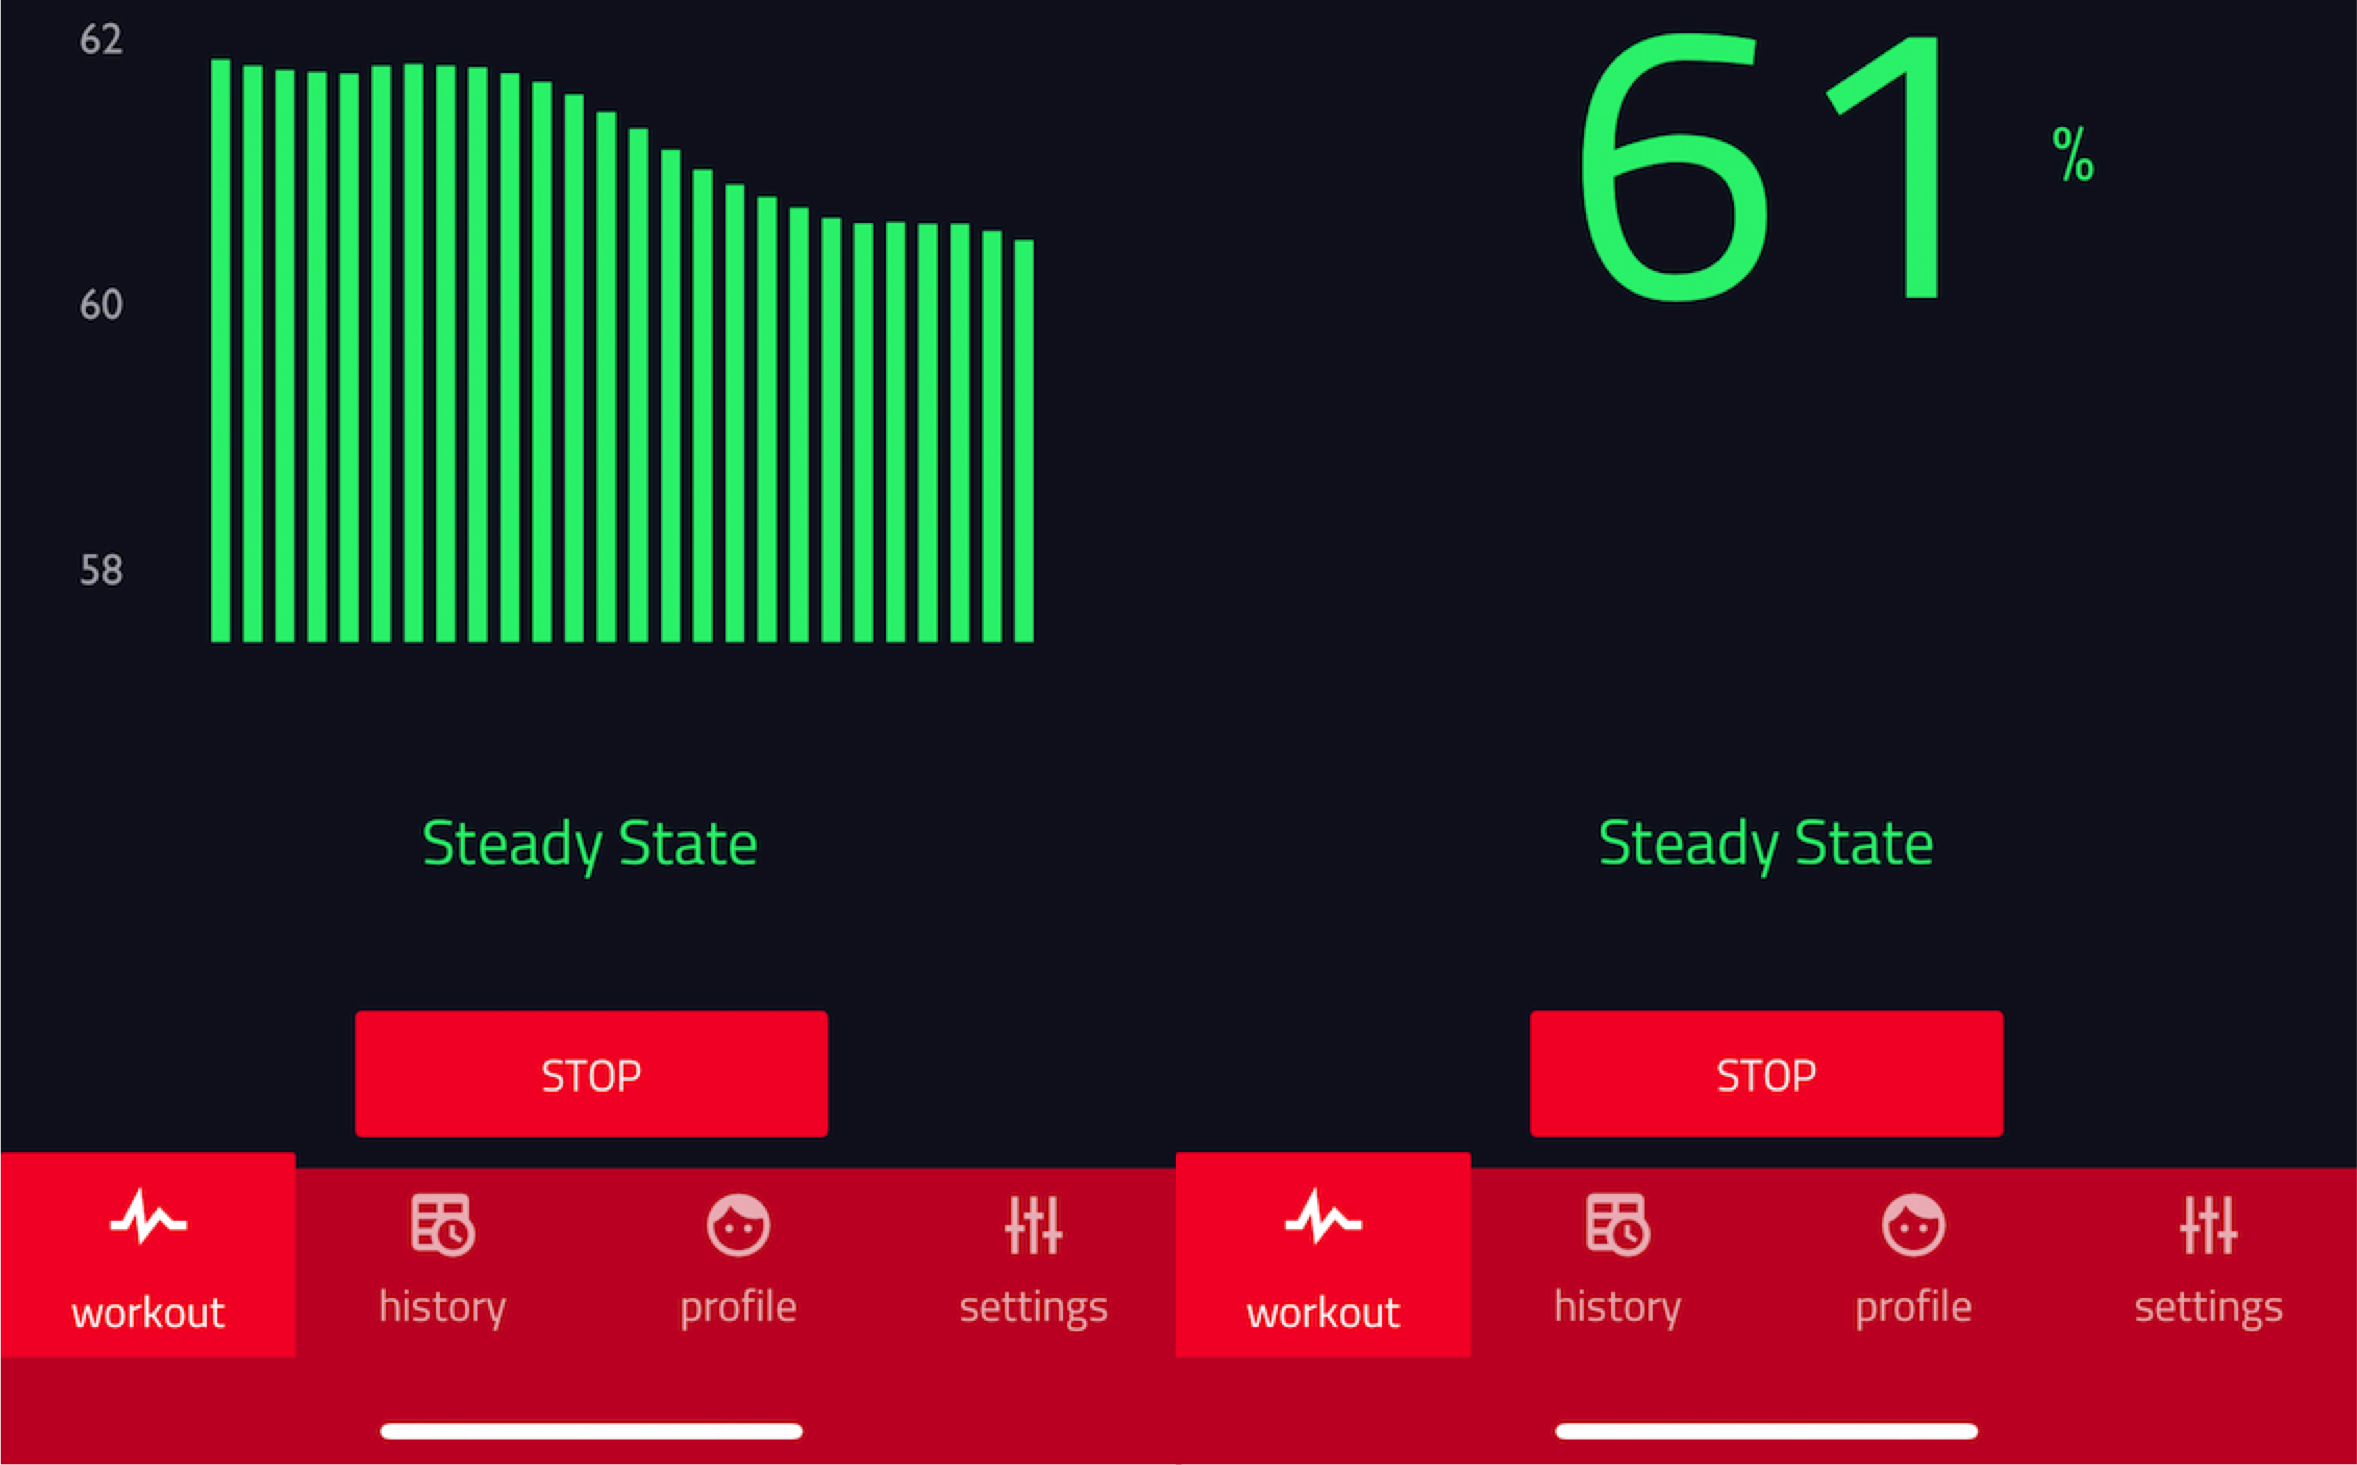
The default display when recording a workout provides your muscle oxygen data as a percentage with the color representing which zone you are in. It can be very useful to view the data as a graph to see the changes faster in real-time. All you need to do is tap the real-time display to switch between views.
Make sure to check out @behumon on Instagram, Twitter, and Facebook.
